
Fear of stagflation and its impact on the real rate of return is natural. In our 2022 market outlook, we look at 1970s stagflation to help putting those fears into perspective.
With everything that has been happening around the globe, it’s worth asking whether we will see a return of 1970s stagflation and what that might mean for our real rate of return. So we took a close look at what happened in the seventies to see how it affects our 2022 market outlook.
As stagflation1 fears mount, we have looked into the empirical evidence of the behavior of capital markets in such periods historically. The analysis is based on the period between the early seventies and the early eighties. The main conclusions based on an analysis of the US market are as follows:
- Nominal returns were actually reasonable, but real returns were negative for equities, bonds and multi-asset portfolios.
- During the stagflationary period, nominal revenues and earnings actually increased substantially. The problem is that valuation halved during the first shock and stayed as low till the early eighties.
- The key negative was the first oil price shock in 1973 and 1974. It took equity markets until 1979 to recover the losses.
- Commodity prices increased 15x in nominal terms between 1972 and 1979 and remarkably gold and oil showed very parallel developments till 1979.
1 Stagflation refers to an economic environment characterized by high inflation and low growth.
Performance
The key point is that there is a huge gap between nominal and real returns. Bond and equity markets both had significantly positive nominal returns during the stagflation period. Equities and bonds doubled in nominal terms over the period and their total returns were almost identical (around 120%). However, in real terms, both had a negative total return, because inflation was higher than nominal returns on average. This is a typical pattern in periods of high inflation: nominal returns look reasonable while real returns are much lower than in a period with low inflation.
Figure 1: Nominal and real equity and bond market performance (total returns)
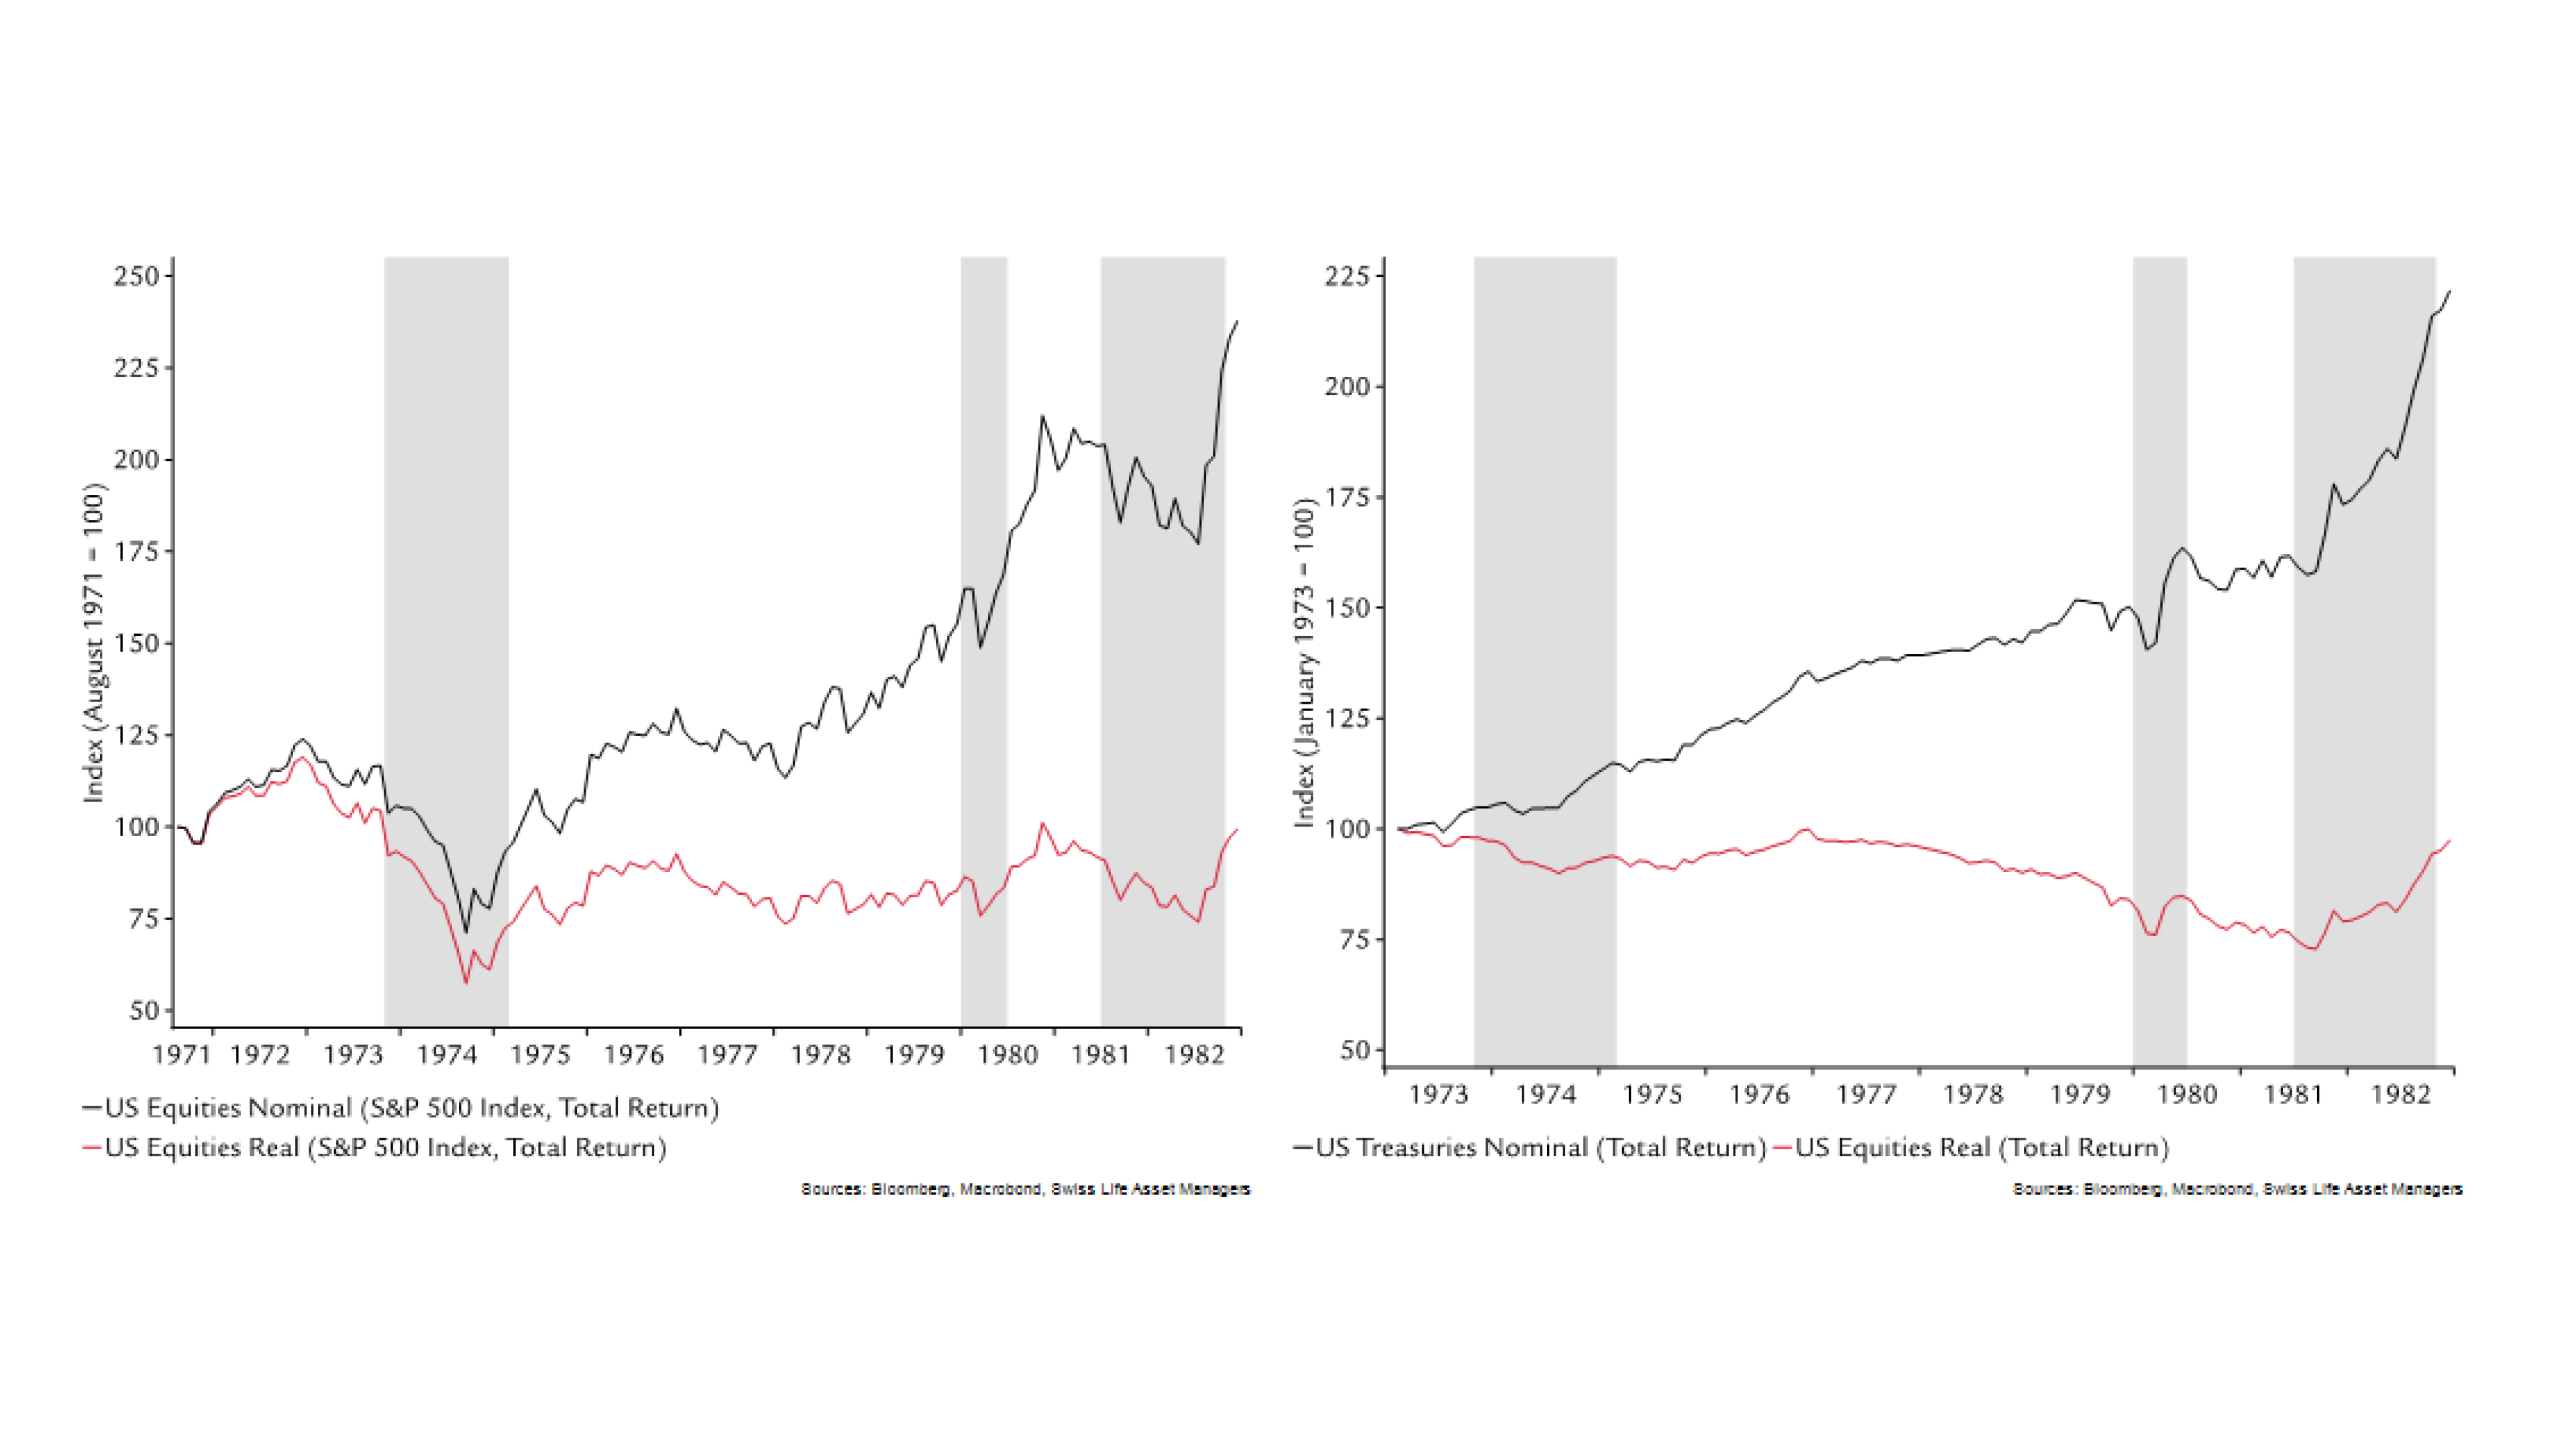
One implication of this pattern is that a mixed portfolio with 50% bonds and 50% equities also had positive nominal and negative real returns. Thus, a typical investor lost purchasing power during the stagflation period.
Figure 2: Nominal and Real Performance of a Multi-Asset Portfolio

The bulk of the performance during the stagflation period comes from coupons and dividends. The average dividend yield was around 4.5% while the average yield of treasures and corporate bonds were 9 and 11% respectively. These figures are very different from the current market environment where the dividend yield is below 2% and the treasury yield is around 3%.
The maximum drawdown (performance from high to low) around the first oil price shock was around 45% and recovery took till 1979 (looking at price changes only. International equity markets had except for Japan, the same problems as the US-market. The Swiss market is the weakest, while Japan is the only market with a remarkable price appreciation. This is due to the exceptional year 1972 where the Japanese equity market more than doubled. But even in Japan, the losses during the first oil price shock were only recovered in 1978.
Figure 3: Performance (nominal) of International Equity Markets (Price Appreciation)

Earnings and Valuation
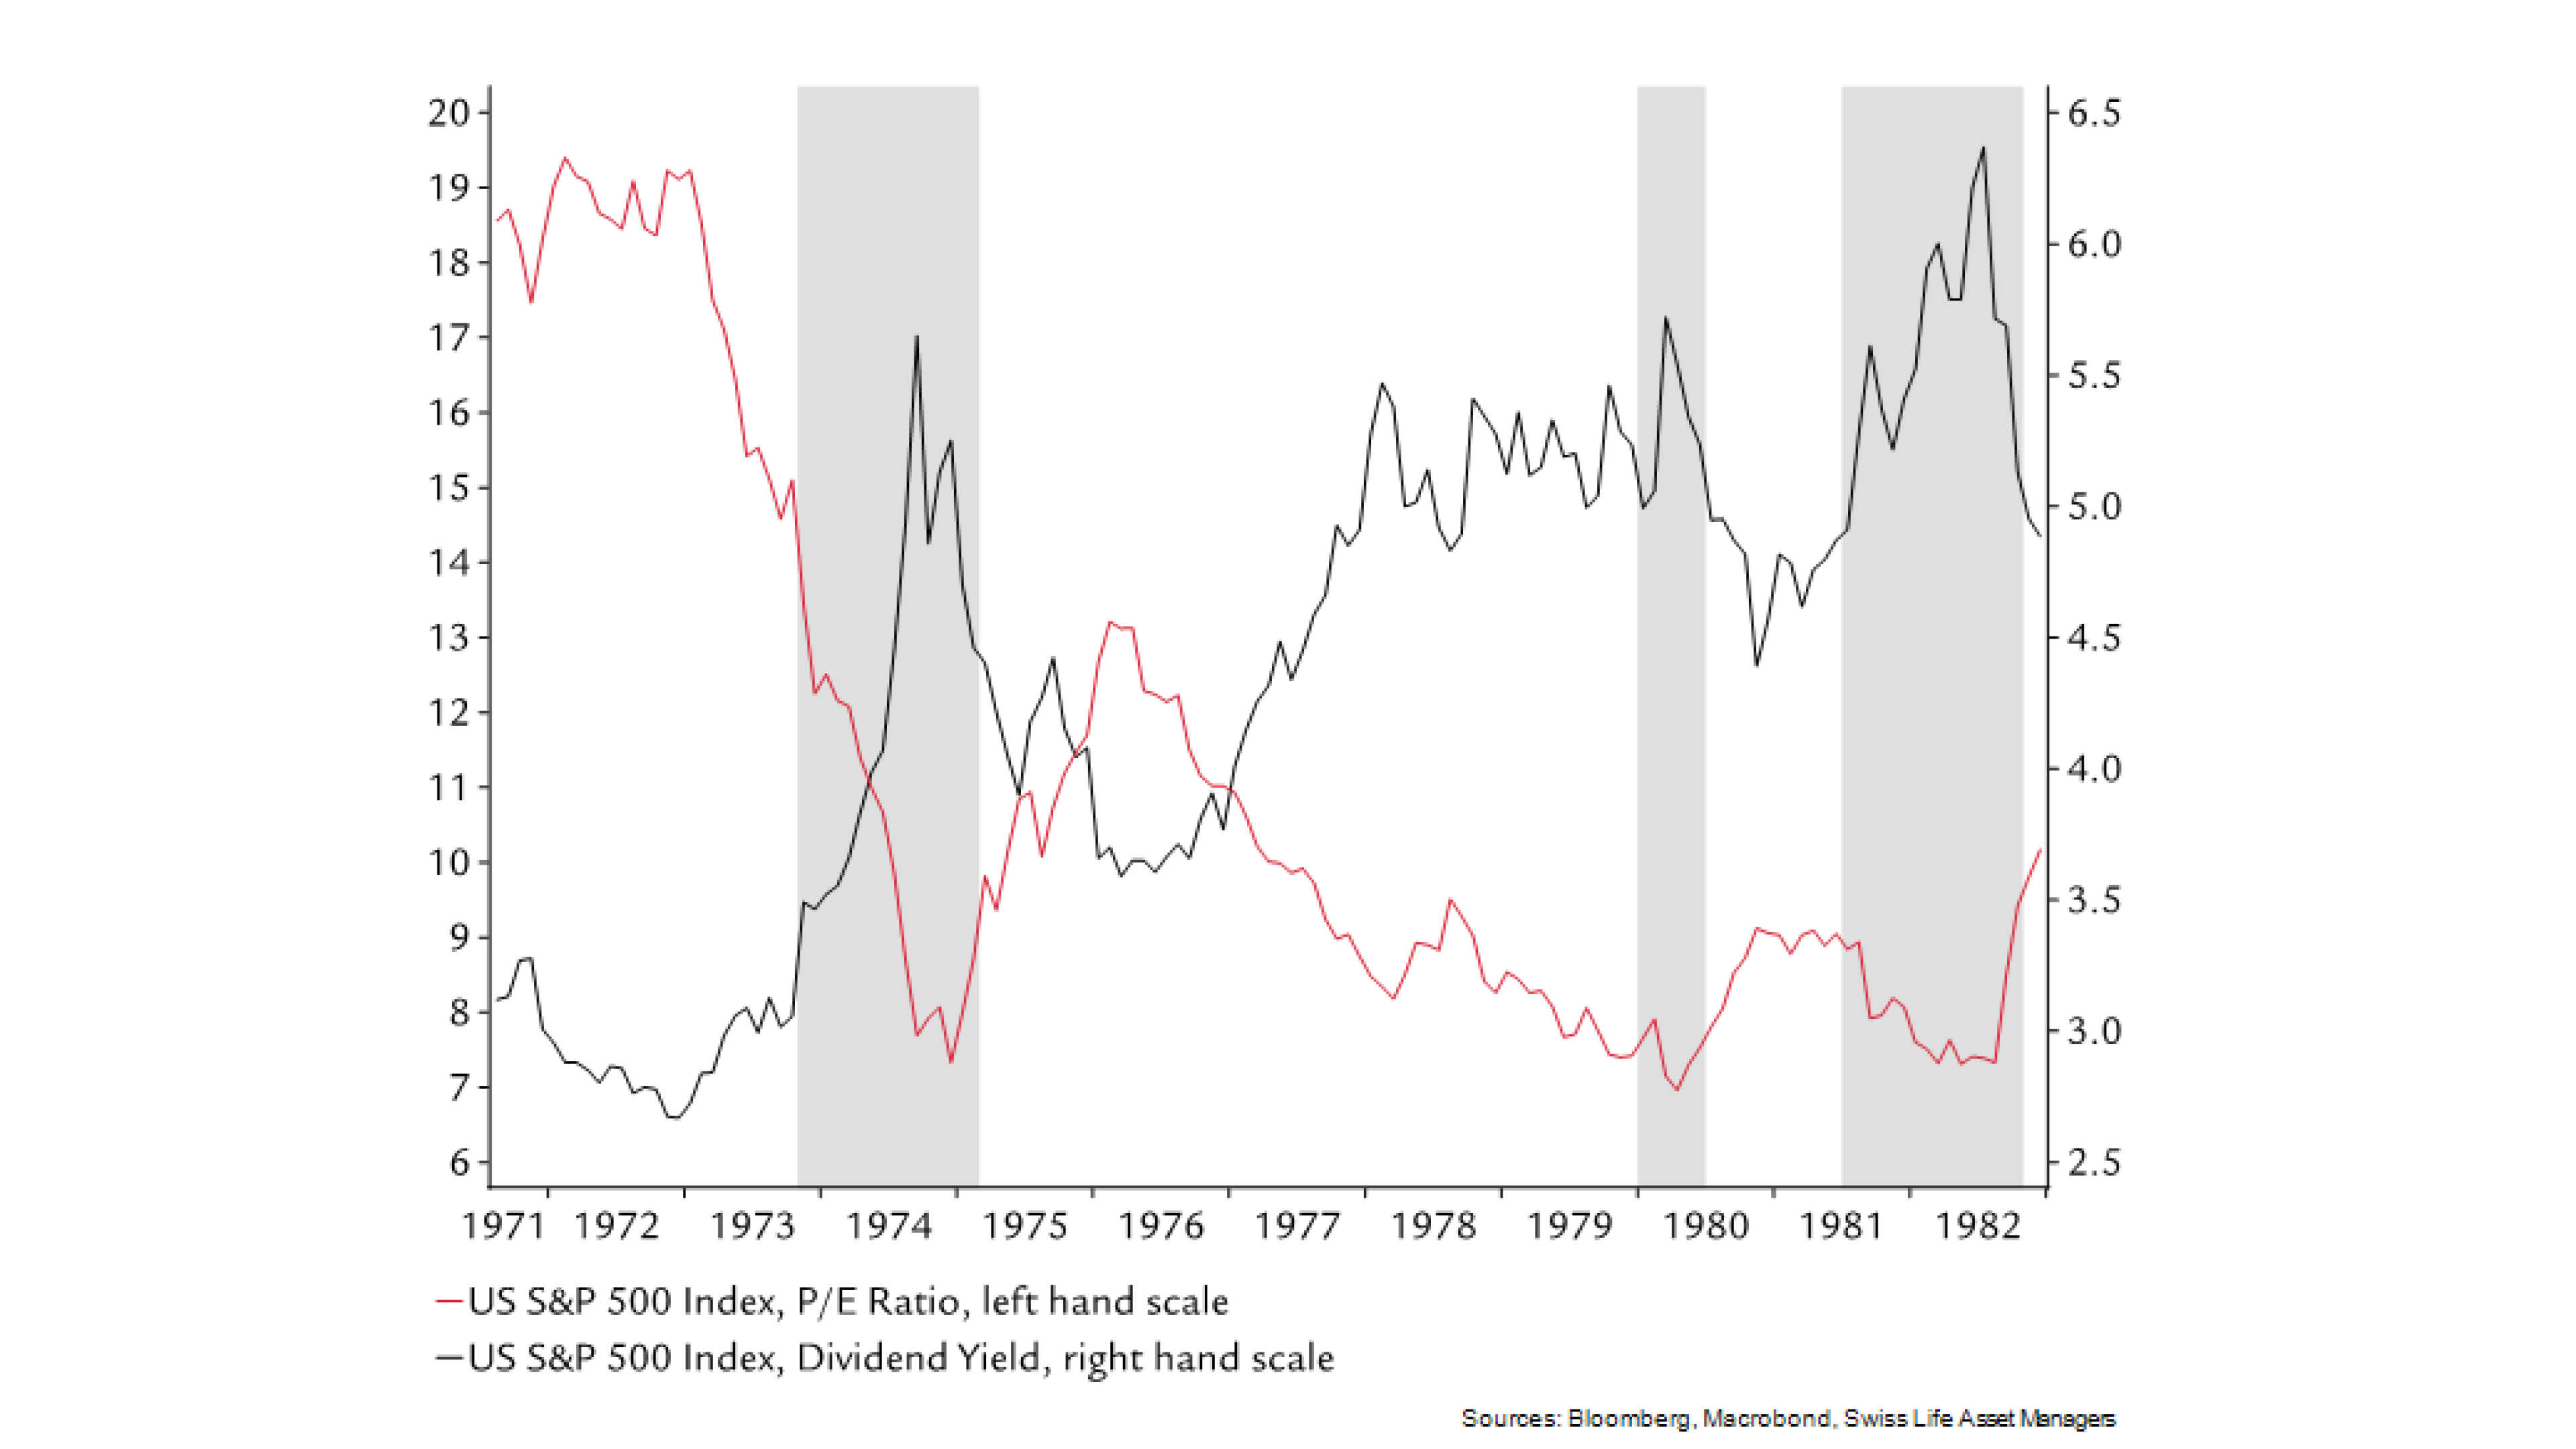
Nominal earnings of the S&P500 almost tripled over the observation period. Even during the first oil price shock, earnings grew. The problem is valuation: a fairly high PE of around 20 was cut in half and remained that low over the entire period. Most likely the cause is that investors demanded a higher equity risk premium after the shock and this higher risk compensation remained quite persistent.
Figure 4: Earnings Growth
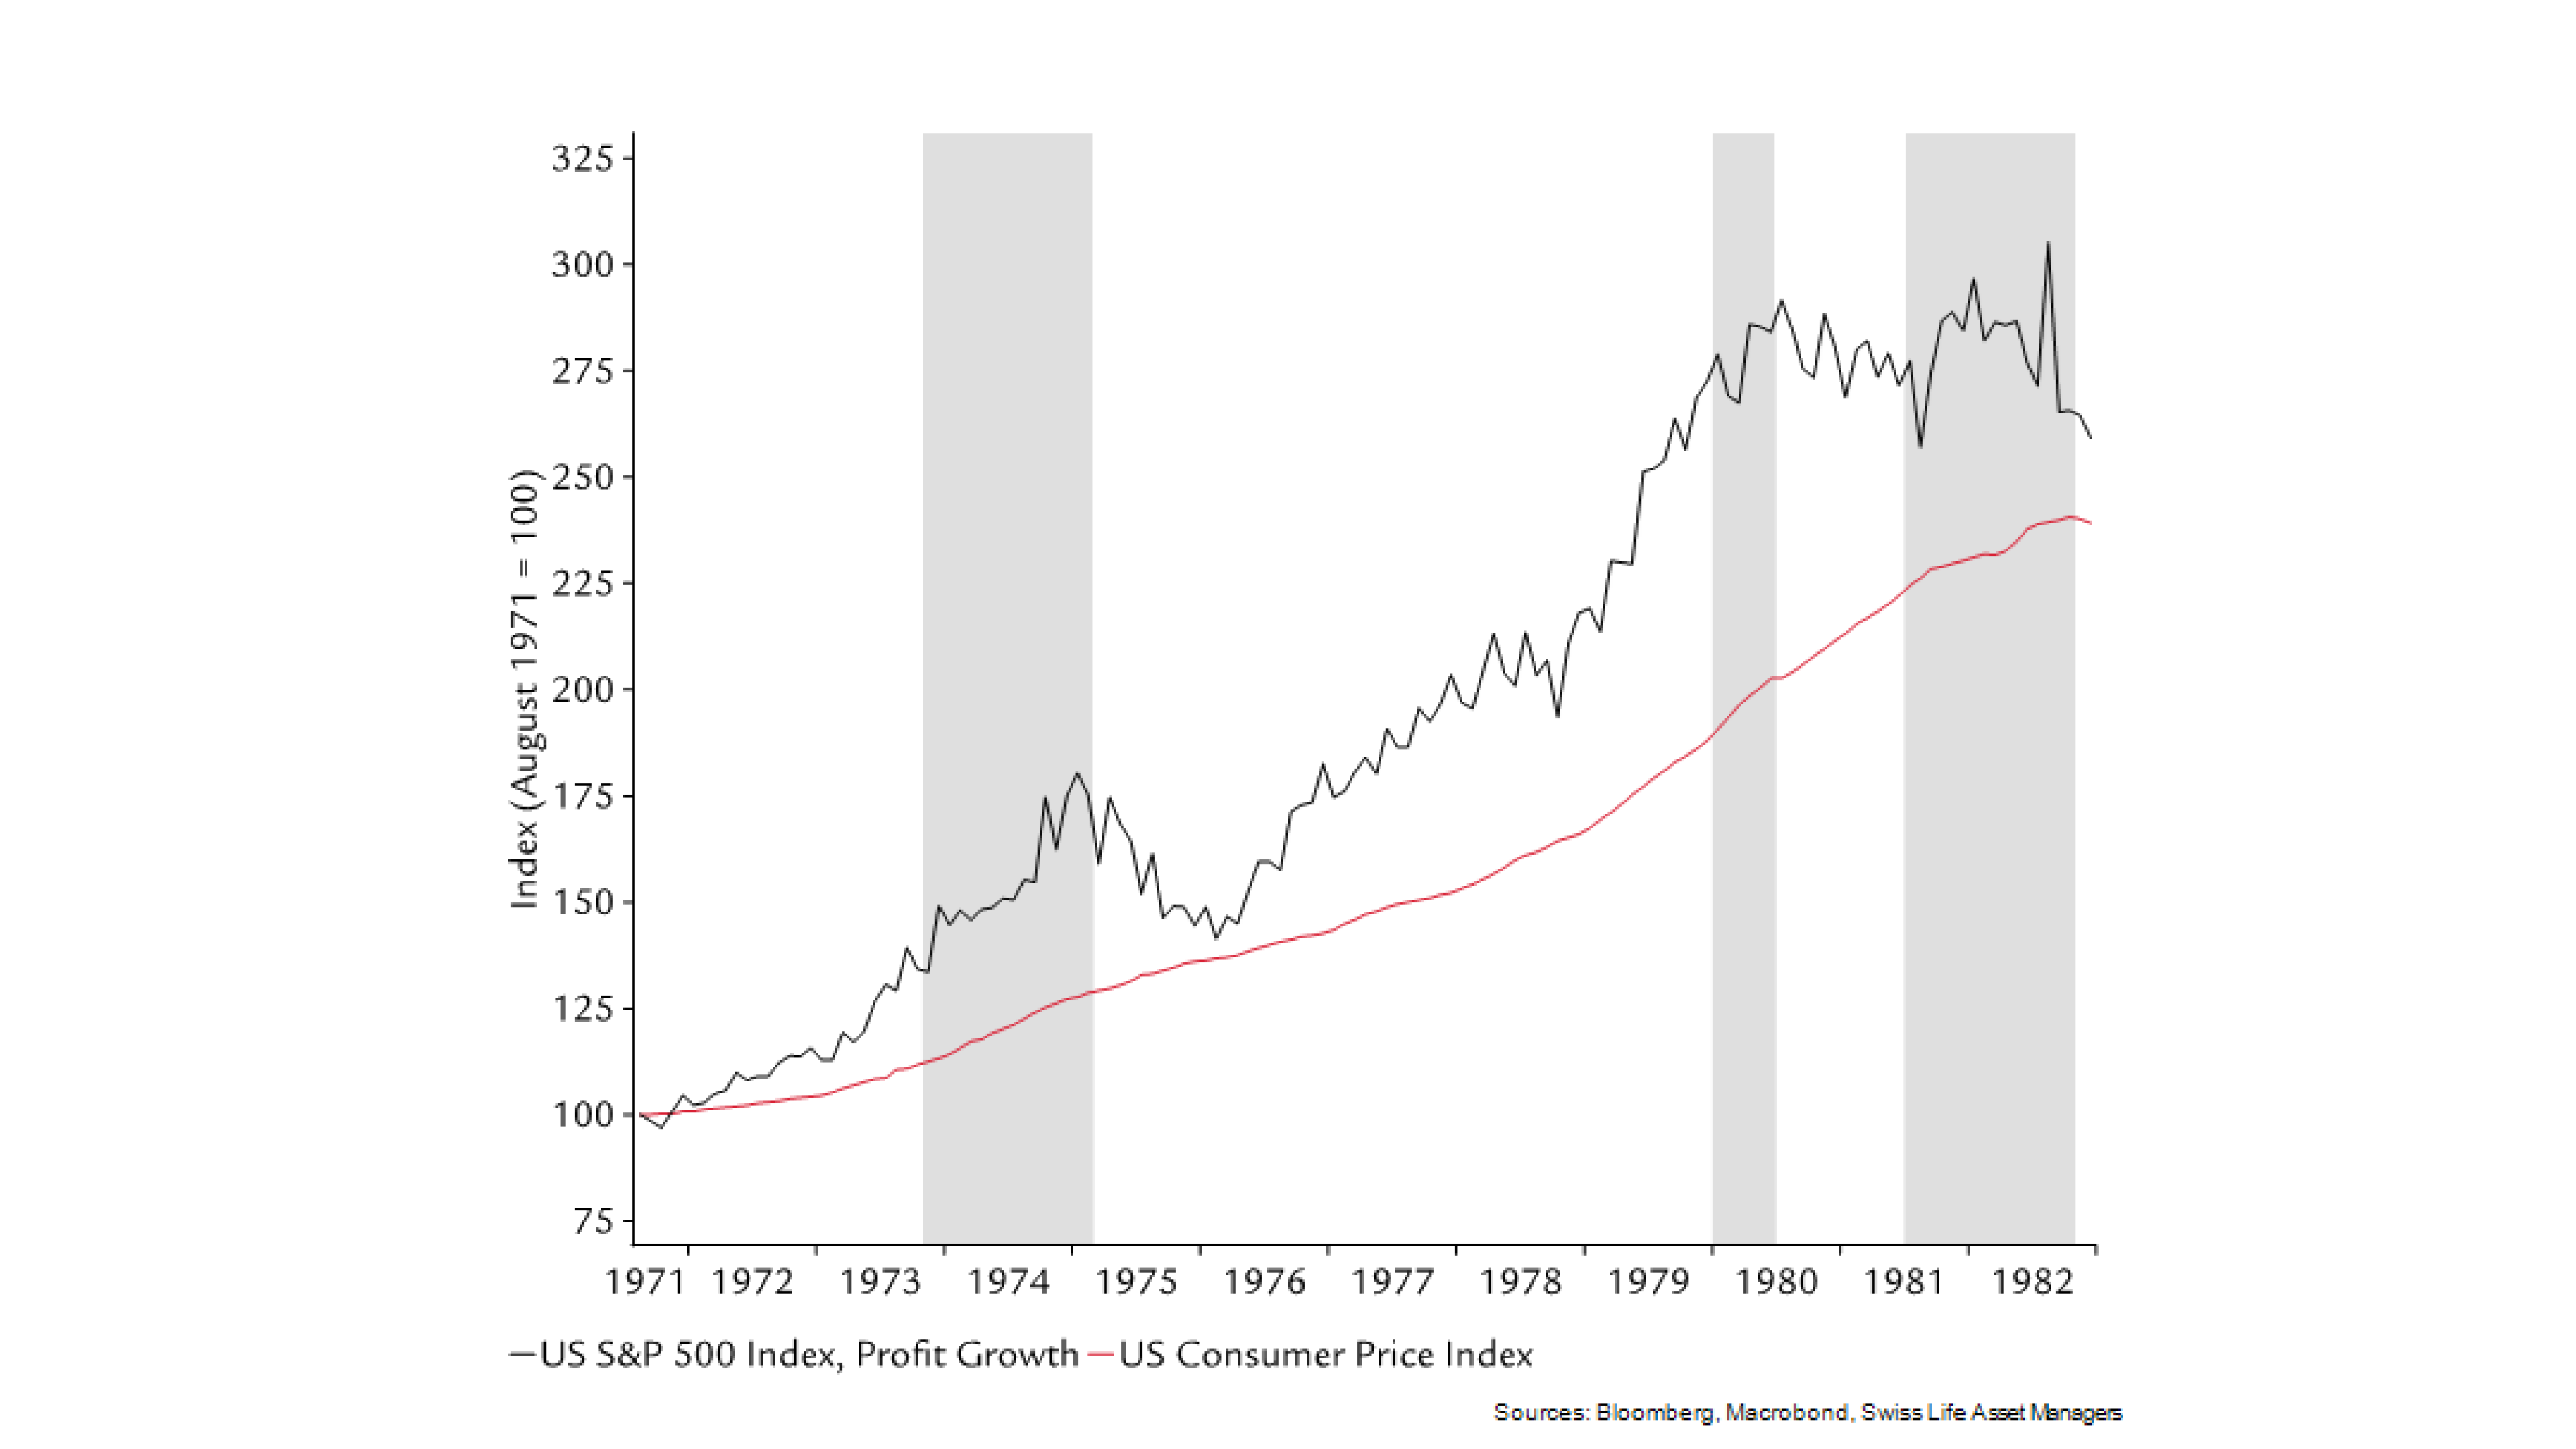
Figure 5: Equity Market Valuation (P/E-Ratio and Dividend Yield)
Commodity Prices
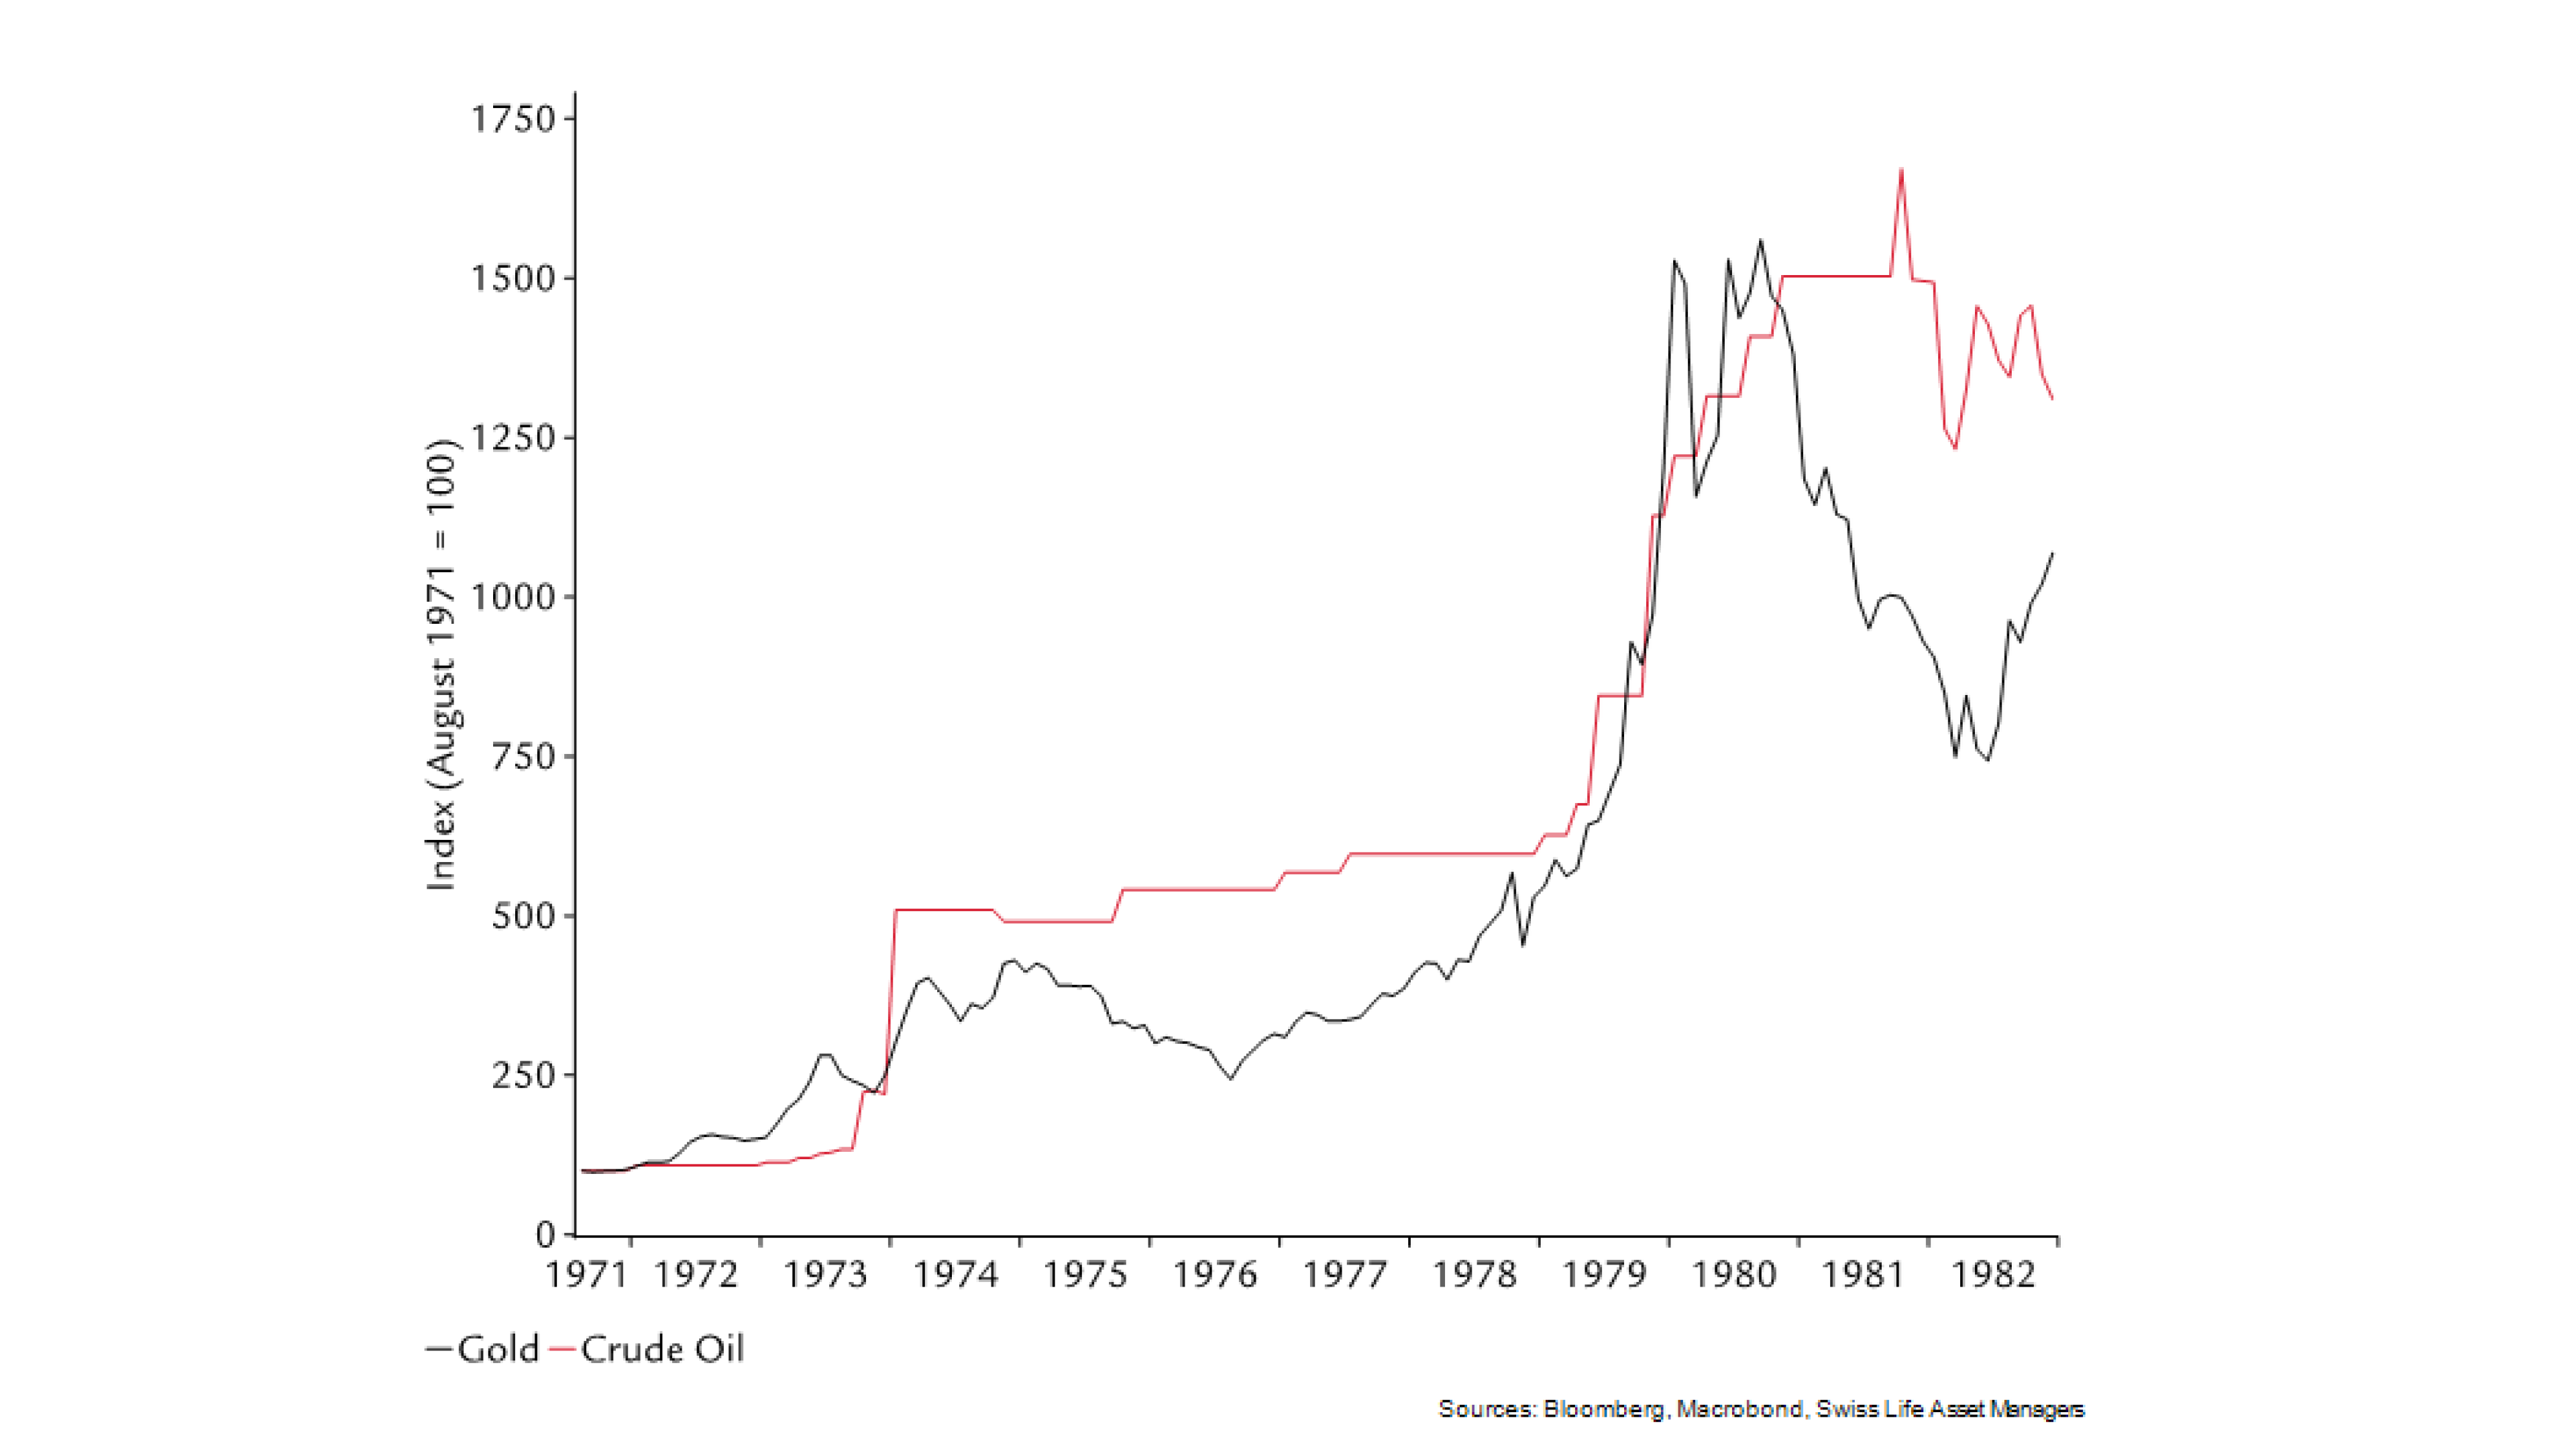
Oil and gold were the "star performers" in the seventies. Prices increased 15x in nominal terms until 1979. The prices increased pretty much in parallel for much of the observation period. Only after the Fed embarked on a new monetary policy regime under the lead of Paul Volcker, the gold price went south while oil remained at elevated levels. The reason is that higher rates increased the opportunity costs of holding gold (gold delivers no cash flows).
Figure 6: Commodity Price Development (in USD)
Seventies vs. Now?
It is clear that an extrapolation of the behavior of the seventies to the current situation (where it is not quite clear whether we will actually enter into stagflation) is not appropriate. We live in very different circumstances today (e.g. in terms of price rigidities, monetary policy philosophy, equity market composition, interest rate environment, energy dependency and so on). Therefore, our analysis is not a prediction about what is going to happen now.
Our current house view is that the US and the global economy will not enter a prolonged stagflation period as we have seen during the seventies.
Author: Andreas Homberger, Product Specialist Equity and Multi-Assets, Swiss Life Asset Managers